Gaining a new customer costs 5-8x more than retaining existing customers, according to Hotel News Now. Yet hospitality professionals and data analysts say they’re still having trouble getting executives on board with using customer feedback analytics to improve guest experiences.
Of course, throwing a pile of money around doesn’t guarantee better guest experiences. The key is to find the right tool, gather and clean useful data, and then analyze it in such a way that you produce clear, data-driven insights that can be shared across your organization.
Introduction: Proving the Value of Customer Feedback Analytics to Managers
“With its ability to streamline processes, provide valuable insights and optimize experiences, [artificial intelligence] is driving the new wave of warm, guest-centric hospitality.”
— Seth Redmore for HotelManagement.com
In this article, we draw on the process laid out in this Voice of Customer guide to demonstrate how a data scientist or hospitality professional can prove the value of guest feedback analytics to their management team and their larger company.
Although the specific insights in this article are particular to the hospitality industry, the process and best practices we outline can be applied to customer feedback analytics in any industry.
We start high-level by analyzing discussion topics and themes in a set of 50,000 TripAdvisor reviews, and their associated sentiment scores. Then we drill down into the details. We identify areas of poor guest experience, discover their root causes, and then make specific, actionable recommendations towards fixing those problems.
Contents:
- Finding and Sourcing Guest Experience Feedback
- Cleaning Customer Feedback Data For Analysis
- Configuring an Analysis and Processing our Data
- Visualizing High-Level Discussion Topics and Themes
- Identifying Areas of Poor Guest Experience
- Examining Individual Reviews to Gain Context and Humanize the Data
- Drawing Conclusions and Making Recommendations to Management
Another quick note: this article was produced using the Lexalytics, an InMoment Company, Spotlight, but the general process outlined here can be applied to any customer feedback analytics tool.
Finding and Sourcing Guest Experience Feedback
As this guide explains, an effective Voice of Customer program is focused on answering questions. As data analysts working with guest feedback analytics in hospitality, our question for this project is: How can we deliver actionable, data-driven insights on how to improve guest experiences?

The best data for VoC analytics comes from customers themselves. For this article, we gathered more than 50,000 customer reviews from ten Best Western locations across the country. To do this, we used the web scraping program WebHarvy to scrape reviews from TripAdvisor.
Search for “Best Western” on TripAdvisor and you’ll get 34 pages of results. That represents thousands of people describing their experiences, voicing concerns, and expressing emotion.
For a big hospitality provider like Best Western, these free-text comments are full of valuable data that the company can use to improve guest experiences — if they’re listening.
Of course, you don’t need nearly this many reviews to gain useful insights. But — as with any research project — the larger the sample size, the higher the statistical significance of the results.
Cleaning and Processing Customer Feedback Data for Analysis
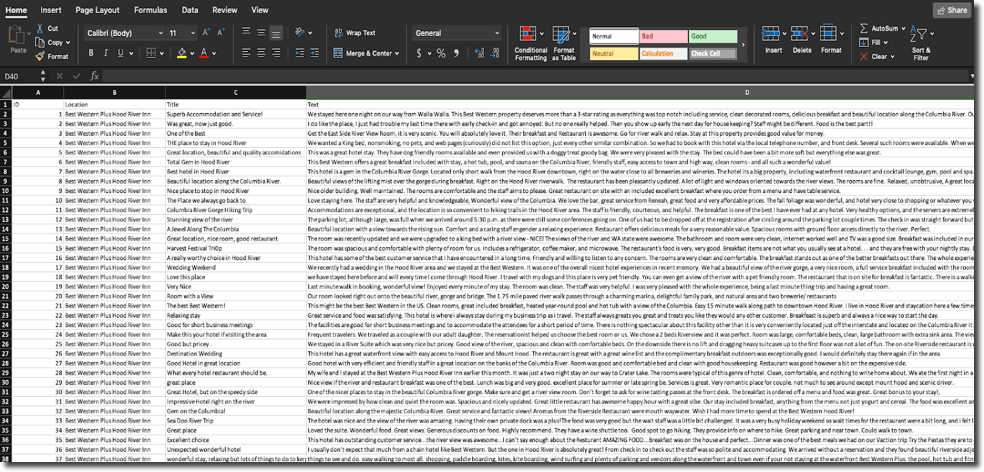
We exported the scraped review data into Microsoft Excel for cleaning. Customer feedback data sets usually contain at least three columns: ID, text, and date.
- ID is simply a referential number representing a row in the data set. The machine uses the ID to index each row of data.
- Text is the natural language document (review, social media post, call log, etc.) that you want to analyze.
- The date represents when the customer created the review.
Of course, your data (spreadsheet) may include many more columns beyond these basic items. These are called metadata: data about data.
For our analysis, we actually used four columns: ID, location, title, and text. Title is the title of the review; location tells us the specific Best Western location that the review references.
You can get as granular as you like with metadata, potentially including dozens or hundreds of data points to draw on. For example, you might include the star rating associated with each review, or the general manager on duty at the time.
Next, we’ll need to make sure our data set is clean. Cleaning a data set can be horribly complex, but just as often it’s both straightforward and monotonous. Often it requires sampling random sections of the data set and looking for errors.
For example, most web scraping platforms are tuned to English and are unable to recognize non-English words and alphabets. Therefore, non-English reviews may appear as irregular characters or total gibberish. You may need to delete these reviews from the data set entirely.
Once you’ve normalized any irregularities in your data set, you’re ready to configure and run an analysis.
Creating a Configuration and Running an Analysis
Next, we create an analysis configuration.
The configuration step in customer feedback analytics is where you add custom entity and topic lists, tune the sentiment analysis system to understand industry-specific phrases, and more.
Without a properly-tuned configuration, you can never be sure that your analysis is producing accurate, reliable results. So it’s critically important that you don’t neglect this step.
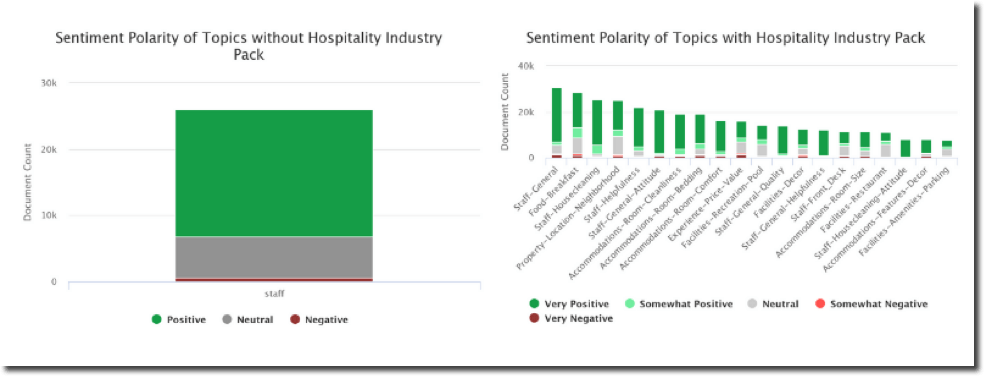
That said, creating a detailed configuration doesn’t have to be time-consuming. Pre-built configurations (like the hospitality industry pack from Lexalytics) makes this quick and easy. With all business intelligence tools, be deliberate in how you balance speed versus accuracy.
Once we create our configuration, we’re ready to run an analysis. In a tool like Spotlight, we do this with a click of a button.
Visualizing High-Level Discussion Topics and Themes
So far, we’ve gathered, cleaned, processed and analyzed our data. Now we’re ready to create dashboards through which we’ll visualize the results.
We recommend you reject the impulse to dive into details right away. Instead, start by creating dashboards to understand the high-level themes, topics, and entities within your data. This systematic approach will help us to tell powerful stories about brand health, trace root causes of poor guest experiences, find context to support your conclusions, and then make data-driven recommendations for Best Western.
Here, we start by creating an analysis widget to visualize overall topic sentiment across our entire dataset.
This initial topic visualization offers an overview of Best Western’s brand health. We see that our data predominantly expresses positive sentiment, with most of our documents (reviews) considered “very positive.”
At this point, it’s important to put ourselves back in our “data analyst shoes” and remember the goal of our project: To provide Best Western’s brand with actionable insights, drawn from their actual customer base, into how they can improve guest experiences.
With this goal in mind, we filtered the sentiment polarity, showing only reviews that express somewhat negative or very negative sentiment (representing poor guest experiences).
Identifying Areas of Poor Guest Experience
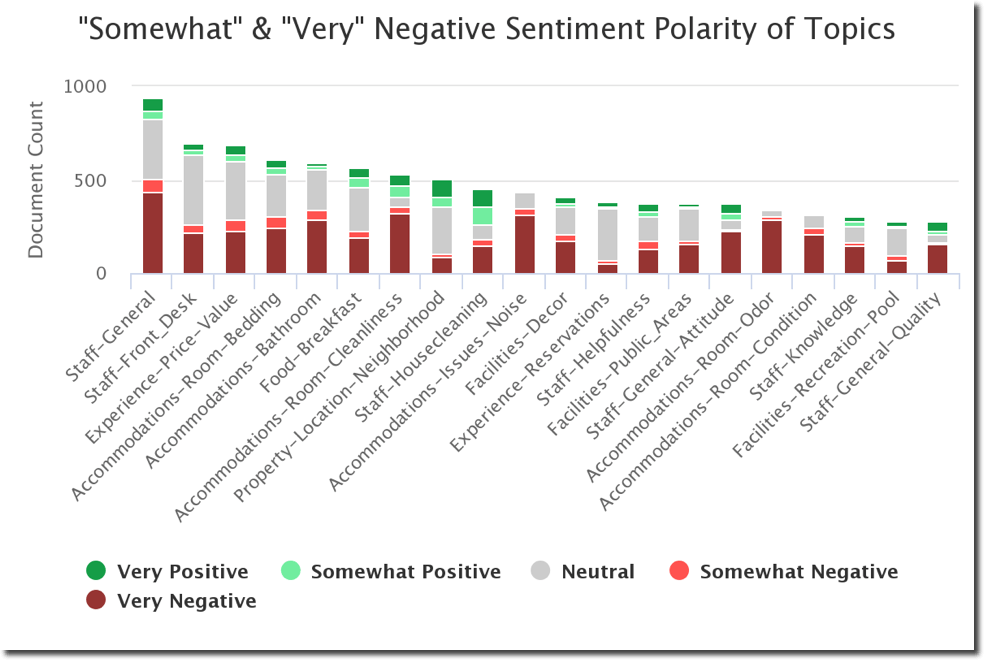
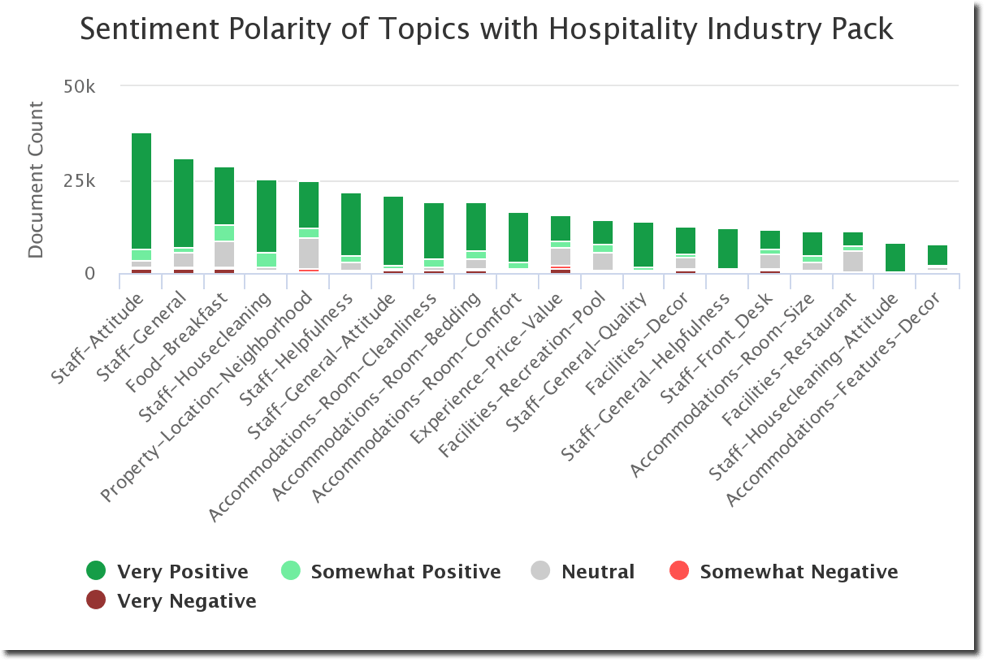
This chart clearly shows the most commonly-occurring topics within our data, along with the distribution of sentiment in each group. Graphing topics with their associated sentiment in this way shows at a glance where the most common trouble areas are. This helps us know which topics to filter down on to reveal trends and relationship within the data.
Let’s focus in on the three topics that represent the highest frequency of “very negative” sentiment. As we will show, Best Western’s three main problem areas are: staff, noise, and the bathroom.
Tracing Problems Back to Their Root Causes
Now that we’ve identified areas of poor guest experience, we must determine their root causes and provide our management team with a more nuanced understanding of guest sentiment.
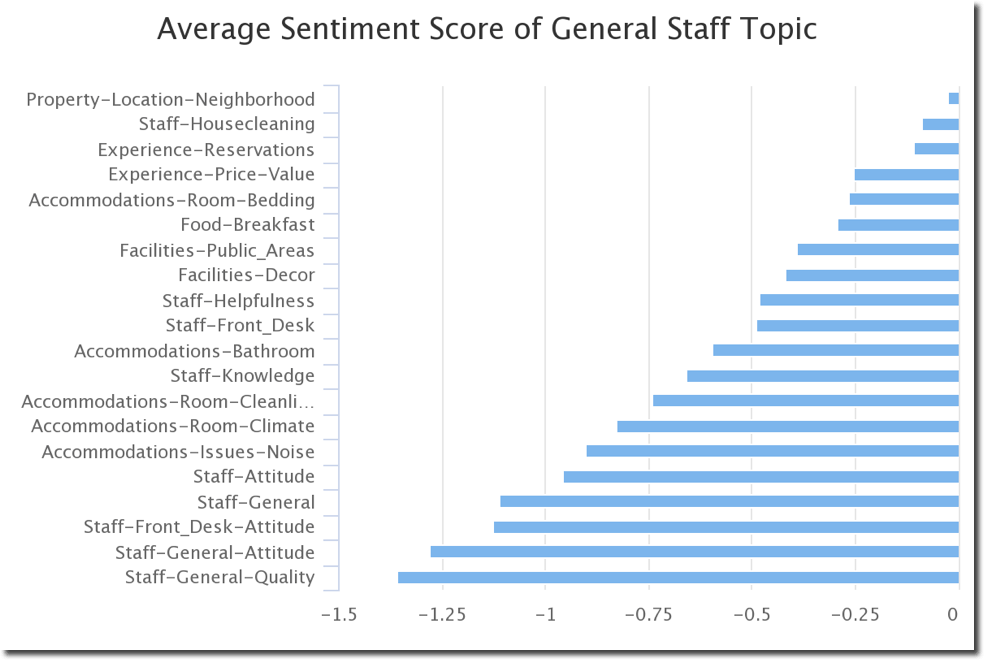
Filtering on the topic of “Staff-General,” we get a clearer picture of why guests who disliked the staff felt that way. Here we see that “Front-Desk Attitude” ranks very poorly (-1.12) in reviews where a customer was unhappy with the staff. We also see negative sentiment with the overall “Staff-Attitude” topic and its -1.28 sentiment score.
This isn’t entirely unexpected. After all, front desk employees have to balance impatient customers and finite resources. But the front desk staff is the vanguard for guest experience, and their attitude can significantly impact the overall guest perception.
Examining Individual Reviews to Gain Context and Humanize the Data
As you interpret the results of your analyses, take time to examine individual documents. These reviews represent tangible evidence of your findings, and a single comment can present powerful context for your conclusions. Digging into our Best Western data set, we discover that many negative comments mention un-engaged staff members.
“Only the front desk people seem too busy to bother. weird as they weren’t busy but hey!”
A poor first impression can dramatically skew a guest’s impression of the rest of their stay. Yet when we examine more reviews, we see that staff periodically fail to meet the needs of guests.
“Check in was unpleasant. I walked in exactly three minutes before four pm, and that earned me a sour look. She took pleasure in fiddling with the keyboard until four o’clock precisely and only THEN checked us in with a smile.”
Investigating further, we see that this negative trend of poor staff engagement persists through the entire guest experience.
“No hot water — lukewarm. Mentioned it at the desk and was told I probably was turning it the wrong way. They do not care if you are happy or not. The staff told me if I wanted better service, I should not use hotels.com. …outrageous!”
 In our data set, these reviews comprise a minority of the sentiment. But they represent a significant-enough minority to be worth addressing.
This is a great example of how data analysts can identify trends of poor customer sentiment and use these types of individual comments to illustrate the issues with their managers. The result is an improved guest experience for their customers and a quick win for the brand.
Drawing Conclusions and Making Recommendations to Management
Noise Complaints: What’s Causing Them?
Now with a process in place, let’s go back to the sentiment topic chart and explore other negative topics. The sentiment score for “Noise” is –0.82, one of the most negative topics in our data set. Diving more in-depth with this topic, we can trace a potential root cause.
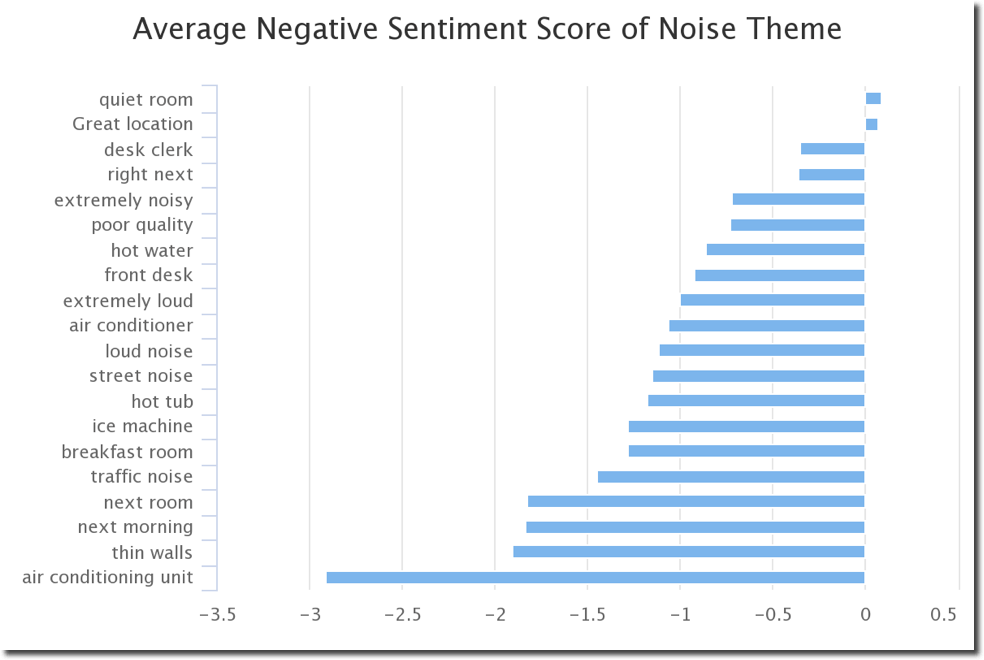
Filtering by “Topic: Noise” shows us an average sentiment score for the most common themes associated with noise-based sentiment. “Air conditioning unit” (-2.91) is the leading cause of negative sentiment by quite a large margin. Let’s look beyond the numbers and identify a supporting document that we can present to a management as solid evidence to support our conclusion.
“World’s noisiest air conditioner was in our room (and I talked to other guests who made the same complaint) — it was tough to sleep because of that.”
What recommendations can we make now?
On the ground, each individual hotel can use these insights to strategically prioritize how they allocate their resources. In particular, they should check their air conditioners and replace or repair problematic/noisy units.
Meanwhile, on a corporate level, Best Western should look to institute a more stringent equipment testing policy, fixing these issues before they hurt guest experiences. Already, Best Western’s management team can claim a quick, cost-effective win for their brand. And we’re still not finished with our analysis.
Drilling Down into Cleanliness Uncovers Another Issue With the Air Conditioning
While examining the topic of “Cleanliness”, we saw that “mildew smell” scored as one of the most negative themes for guests. This is quite understandable: nobody wants to sleep somewhere that smells like a wet raccoon, let alone in a hotel they’re paying for.
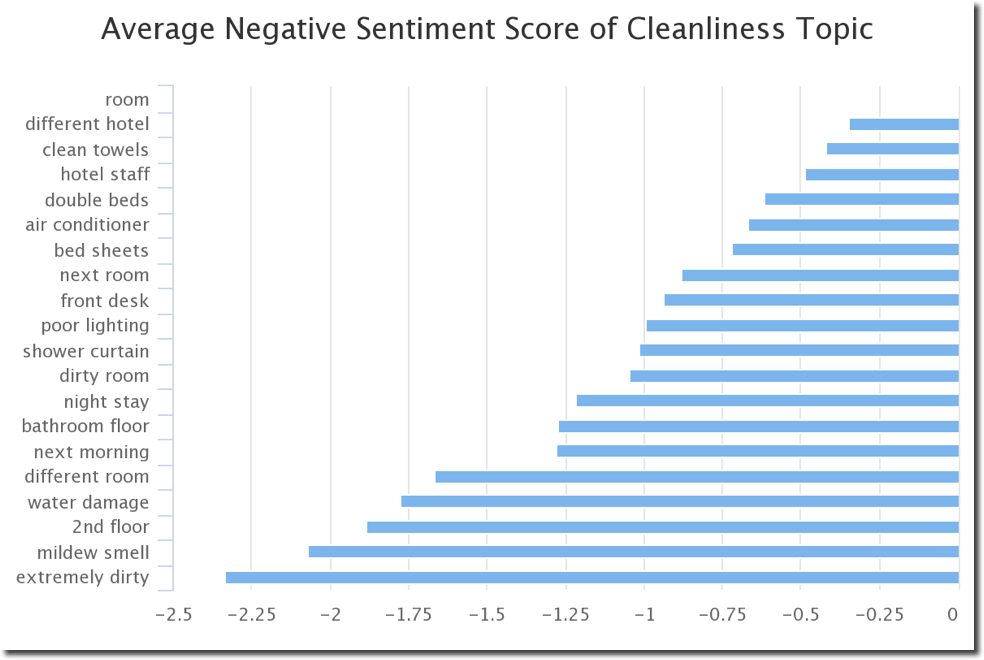
What’s causing this mildew smell? Let’s dive into some individual reviews to find supporting context.
“The carpet was saturated from the air conditioner. The a/c was on the wall next to the bathroom which was at the entrance to the room. Every time we entered the room or exited, or used the bathroom, we had to walk on the wet carpet. I’m sure that is also why the room smelled.”
It seems our old friend, the A/C unit, is at the root of another problem that leads to unhappy customers. Indeed, we find more support for this conclusion as we look through more reviews.
“The air conditioner leaked in the carpet and it was moldy. You could not walk on the carpet without getting your feet completely black.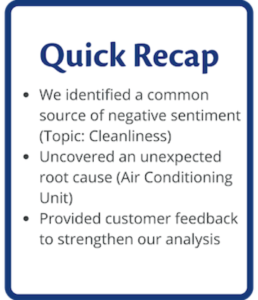 Best Western can pick up another quick win here. Repairing air conditioning units will not only reduce noise, but also improve room smell and overall cleanliness.
This previously-hidden insight highlights the the value of taking a multi-layered approach to customer feedback analytics.
More Unexpected Insights: Best Western Has an Issue with Bathroom Doors
In the final portion of our analysis, our data set yielded another unexpected insight. This time, we uncovered some issues with the topic of Best Western’s “bathroom accommodations“.
Filtering by negatively-scored themes associated with the larger topic of “bathroom”, we discover that “bathroom door” is the most negative theme with a whopping -1.69 sentiment score.
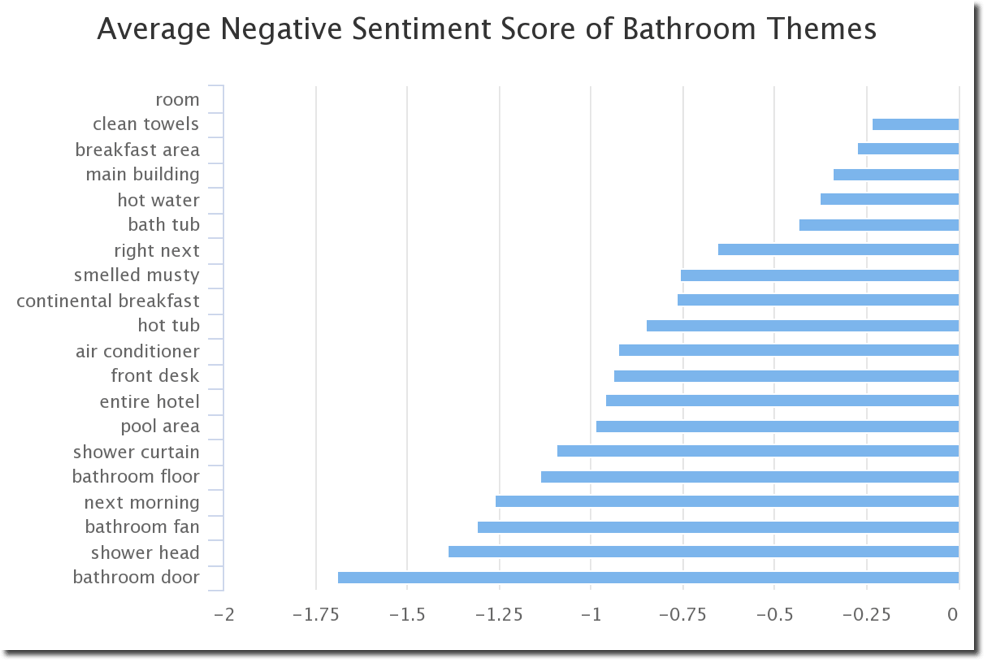
Why are our guests so upset with their bathroom doors? Once again, examining individual reviews helps us to trace the root cause.
“The bathroom door didn’t work properly. Everything could be heard in the room from other rooms and outside.”
Understandably, non-functioning bathroom doors can lead to very upset hotel guests.
“The thing that irked me the most was the bathroom door. It absolutely, would NOT stay open. It REALLY got on my nerves.”
One customer didn’t even get the chance to close their door.
“Inside handle of bathroom door fell off at first use, was not fixed during our stay.”
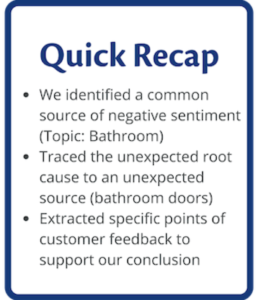 Once again we’ve used multiple layers of analysis to tell a powerful (and useful) story. In this case, a deeper dive into bathroom sentiment scores revealed the root cause: bathroom doors.
This insight offers a simple but effective fix for Best Western: mandate periodic bathroom door inspections. Cost-effective and actionable, this type of recommendation is another great win for any data analyst.
From Data to Value: Prioritizing Changes
Now that we’ve drawn our conclusions, what next?
With so much data and so many insights to work with, it’s important to put together a clear action plan.
Remember: hospitality providers cite resource limitations as a significant hurdle to addressing customer complaints, particularly in matters of equipment upgrades and facility repairs.
As a data scientist, you should act as a link between hard data, the insights you generate, your company’s overall priorities, and the resource constraints your managers operate in.
This point in your analysis is where you should take a step back to compare and contrast the conclusions you’ve drawn with your own business’ priorities. As Lexalytics’ own CMO points out,
“AI can use occupancy data, guest feedback, and self-reported guest data to gauge which upgrades, or repairs should be implemented first and which improvements will deliver the best return.” – Seth Redmore, HotelManagement.com
Finish your customer feedback analytics project by translating your dashboards into clear recommendations (even bulleted lists) of the simplest, most cost-effective actions your brand can take. Show your team how, by doing these things, they can create superior experiences that keep their guests coming back for more.
Guest Feedback Analytics: What Did We Accomplish?
By starting with high-level discussion topics and themes, and then diving down into individual reviews, our analysis of Best Western guest feedback has yielded: 
- Areas of poor guest experience
- Detailed data points to support our conclusions
- Specific action items, including quick wins and larger issues
This analysis serves as a blueprint for any data analyst or hospitality professional. Use these guidelines and ideas to create a valuable report for your management team.
We know the challenges with getting your management team to listen; with strong stories and real solutions, they’ll hear you. The success of your customer feedback analytics work will mean success for you, your company, and your customers – it’s a win all around.
And we’ll all sleep a little better for it.
Further Reading on Customer Feedback Analytics in the Hospitality Industry
Hotel News Now: 10 Tips for Retaining Loyal Guests
6 Ways Artificial Intelligence is Already Impacting Hospitality
Analyzing Airport Reviews with Natural Language Processing
—