Platform
Spotlight
Unlock a new world of unstructured data analysis. A web-based business intelligence application that stores, analyzes, and realizes value from unstructured text documents. Uncover context-rich patterns and insights hidden within mountains of social comments, surveys, reviews, and other text documents. Find out who’s talking, what they’re talking about, how they feel, and why.
Uncover Key Insights
Qualitative Customer and Employee Feedback Deep Dive
Improve Customer Experiences
Activate Voice of Customer
Reduce Employee Turnover
Drive Employee Commitment
Market More Effectively
Understand Market Dynamics
Super-Charge Your Experience Program
Organizations get more value from their text data by using Spotlight to supercharge their Voice of Customer, Voice of Employee, and Social Listening programs.
Leverage Text Capabilities
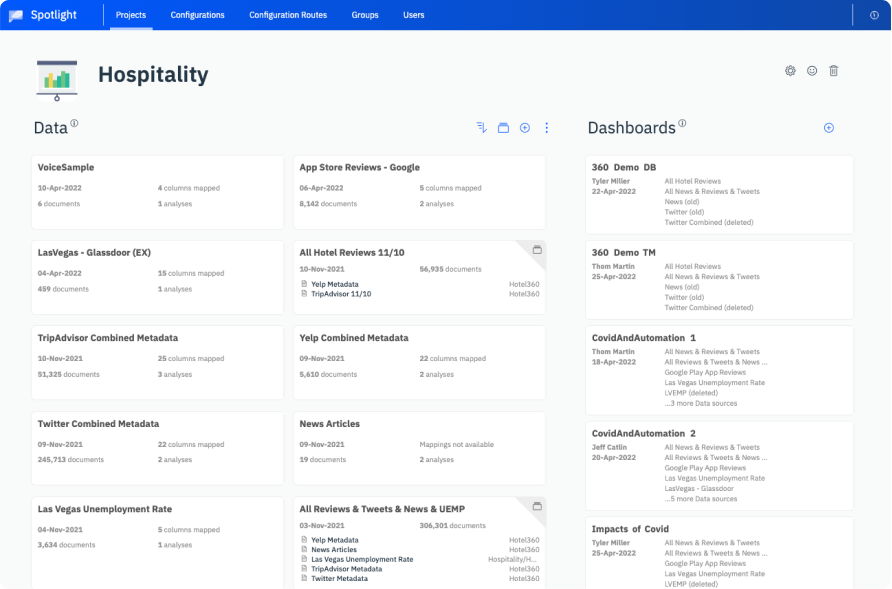
Store and Manage Text Documents
Build and manage document collections from diverse sources inside one platform. Set up incoming data flows for automatic analysis. Assign roles and manage permissions for each user. Group related analyses to monitor trends over time, evaluate performance across locations, or compare different data sources for clearer insights
Fine-Grained Control
Quickly Build and Configure
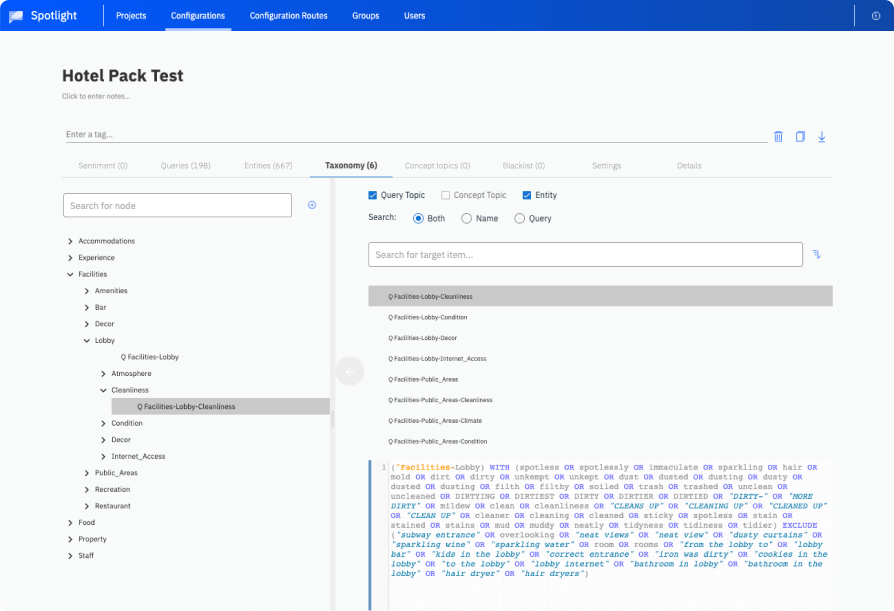
See results right away as you jumpstart with our powerful out-of-the-box tuned industry packs. When you need to adjust for an even closer fit to your business, get in and build and tune analysis configurations with our intuitive graphical configuration tools. Define custom entities, create query topics, add blacklists, build category taxonomies, and more. There’s no need to wait for special services when you can make changes immediately.
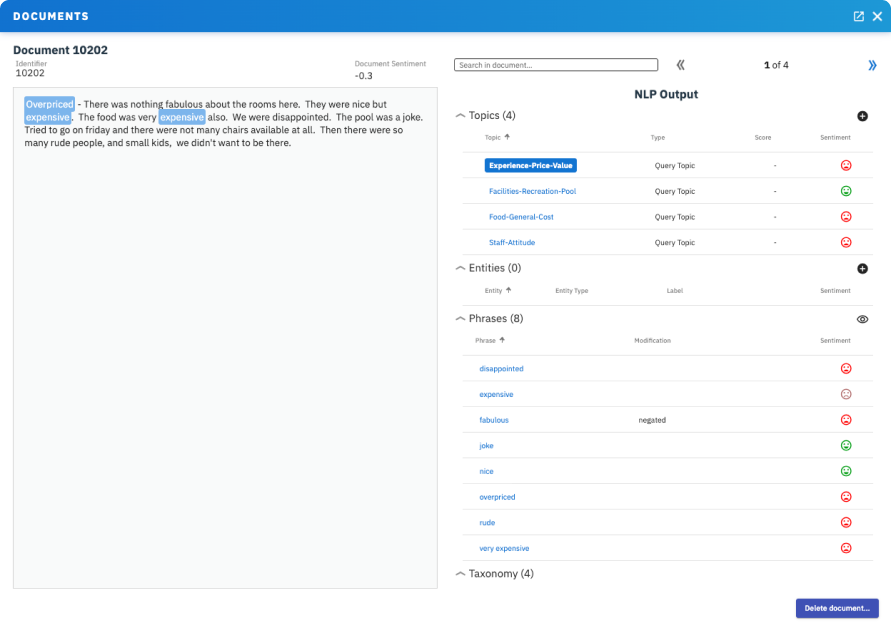
Multi-Faceted NLP
Enterprise-Grade Text Analysis
Assign roles and manage permissions for each user, ensuring they have the exact access to what they need to do their job quickly and easily, no more, no less. Set up incoming data flows for automatic analysis. Group related analyses to monitor trends over time to
- Understand how customer signals such as emotion, effort, and intent are changing and respond appropriately
- Evaluate performance across locations to elevate success and replicate it in lower-performing sites
- Compare different data sources for clearer insights into whether the conversation varies by source and whether any need a change in messaging or business response to better fulfill the audience’s needs
Make Use of Key Insights
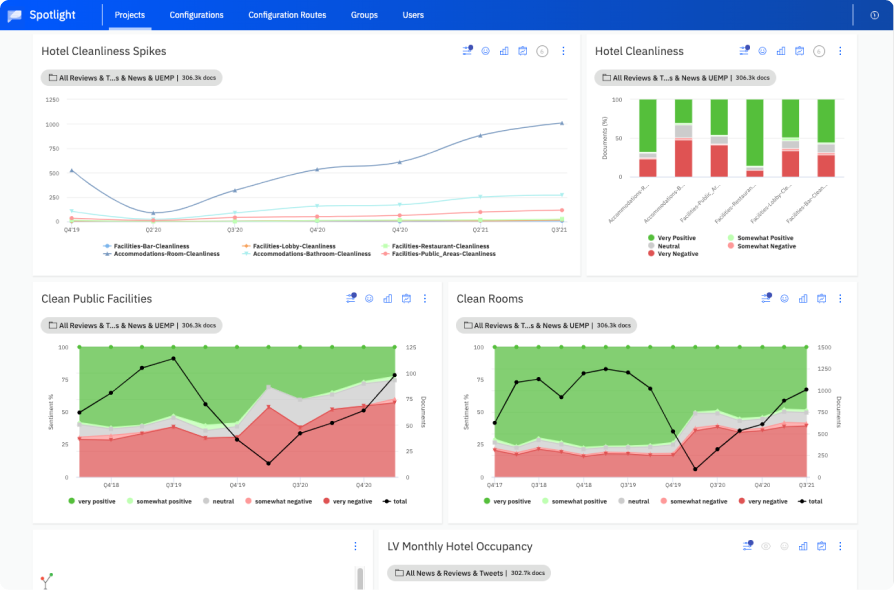
Build and Share Dashboards
Tell powerful stories of customer experience, public opinion, and employee engagement and commitment while helping product, support, and other teams improve customer experiences, reduce employee churn, and communicate more effectively.
Export dashboards to Microsoft PowerPoint, or download the data in .csv or .json format for direct upload into an organization’s business intelligence or data analytics infrastructure. Easily disseminate insights across the organization to break down silos, eliminate blind spots, and foster better decision-making.
30
Languages
Custom
Machine Learning Models
45+
Industry Packs
Languages We Serve
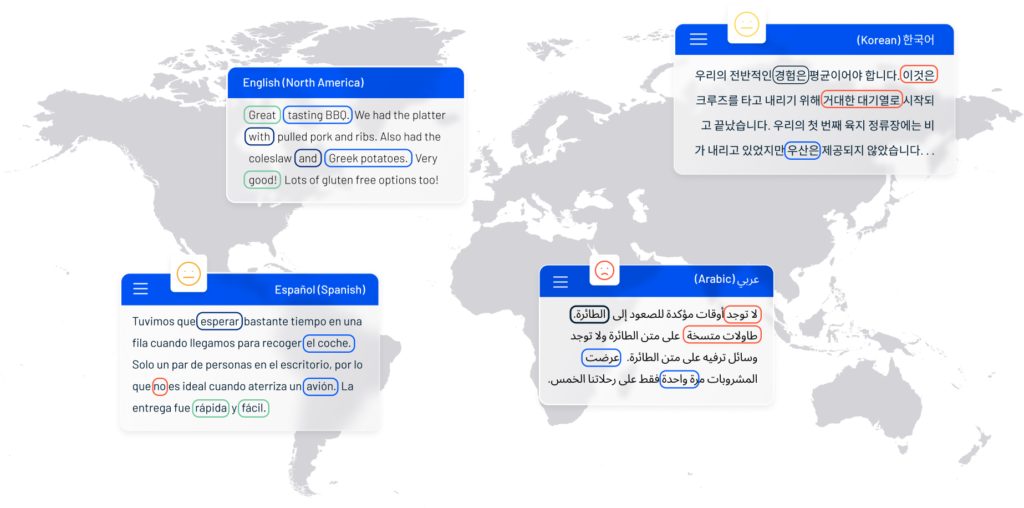
Spotlight is compatible with 30 languages and dialects, representing 67% of the world’s population across six continents.
Arabic, Croatian, Czech, Danish, Dutch, English, Finnish, French, German, Hebrew, Hungarian, Indonesian, Italian, Japanese, Korean, Malay, Mandarin, Norwegian, Polish, Portuguese, Romanian, Russian, Singlish, Slovakian, Slovenian, Spanish, Swedish, Thai, Turkish, Vietnamese.
45+ Industry and Applications Packs
Our solution uses Spotlight pre-built configurations to deliver out-of-the-box improvements in sentiment accuracy, topic detection and entity recognition. Available for 45+ industries and applications such as:
- Hotels
- E-Commerce
- Airlines
- Pharma
- Restaurants – Fast Casual
- Restaurants – Full Service
- Voice of Employee
- Automobiles
- Commercial Insurance
- Energy
- Banking
- Retail
- Health Insurance
- Financial
- Agricultural
- Manufacturing
Popular Use Cases
Brand Monitoring – Gain a Competitive Advantage
Proactively analyze synthesized data from surveys, reviews, and social media data to gain intelligence about customers on an ongoing basis. Create lists of custom topics, follow trending topics as they evolve, and compare sentiment scores across multiple organization-specific metrics.
Product Development & Optimization – Pinpoint Product Opportunities and Risks
Analyze the pooled feedback sources from product support logs, social product feedback, customer survey content, and competitor product reviews to identify commonly requested feature requests, rarely mentioned features/capabilities, and common or recurring product quality issues.
Churn Reduction – Retain Valued Customers
Bring together and connect the unstructured data in solicited feedback, social media communication, call center transcripts, chat and service requests, and other touchpoints, analyze it with a combination of machine learning and industry knowledge-based models to determine the drivers of churn.
Regulatory Compliance – Lower Costs and Risks
Combine semi-structured data parsing, natural language processing, and machine learning to improve existing compliance processes. Scale compliance teams more easily, resulting in lower costs and reduced risk across the organization.